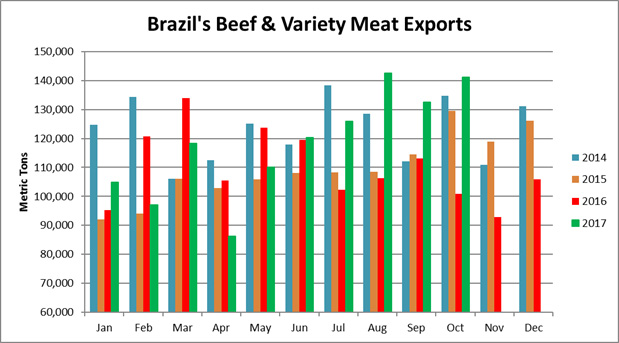
Brazilian beef and meat products exports in 2016-2017
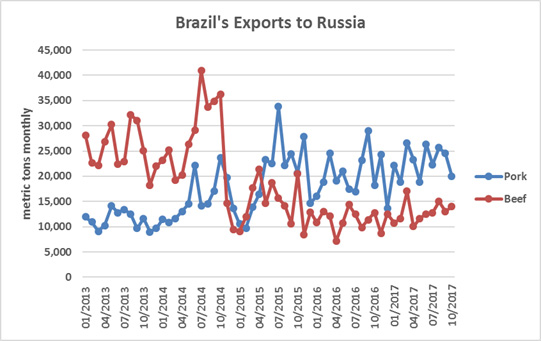
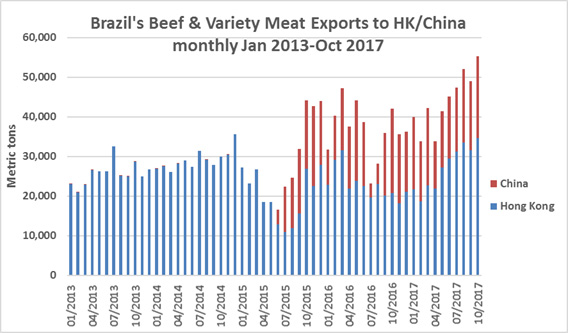
Jan-Oct Brazil’s exports climbed 5% ahead of last year to 1.179 mmt with strong growth to Hong Kong, China, Russia, Iran, Saudi Arabia, the U.S., the UAE, Israel, Singapore and Angola more than offsetting the slowdown to Egypt, EU, and Chile. Exports to China/Hong Kong combined totaled 440,000 mt, up 19% and accounted for 37% of export volume. Brazil’s exports to the rest of the world, excluding China/HK were down 2% from last year, at 739,400 mt. MAPA data shows the recovery in Brazil’s cattle slaughter in the July-Sept quarter, at 6.485 mil head, it was up 8% yoy, with a larger number of females and as producers reacted to the recovery in cattle prices. Slaughter remains well-below the peak levels of 2014. For reference, Q1 slaughter was 6.17 mil head, up 3% but Q2 was 6.04 mil head, down 5% yoy. Growth in production is expected to continue through the end of this year and into next year (WBR).
SOURCE: GTA
|
|
10/2016 |
10/2017 |
Yr/yr % |
Jan-Oct '16 |
Jan-Oct '17 |
Yr/yr % |
|
World |
100,870 |
141,198 |
40% |
1,121,028 |
1,179,361 |
5% |
|
Hong Kong |
20,694 |
34,684 |
68% |
235,098 |
272,493 |
16% |
|
China |
21,314 |
20,615 |
-3% |
133,424 |
167,479 |
26% |
|
Russia |
12,800 |
14,004 |
9% |
114,576 |
128,359 |
12% |
|
Egypt |
6,413 |
19,030 |
197% |
167,918 |
122,833 |
-27% |
|
Iran |
8,463 |
17,631 |
108% |
70,654 |
106,969 |
51% |
|
~EU-28 |
7,983 |
10,746 |
35% |
88,789 |
78,992 |
-11% |
|
Chile |
4,324 |
4,603 |
6% |
57,731 |
48,513 |
-16% |
|
Saudi Arabia |
1,424 |
2,027 |
42% |
23,914 |
38,019 |
59% |
|
United States |
3,048 |
2,270 |
-26% |
27,436 |
34,046 |
24% |
|
Italy |
2,337 |
3,477 |
49% |
24,344 |
22,300 |
-8% |
|
United Kingdom |
2,269 |
2,922 |
29% |
25,940 |
20,098 |
-23% |
|
United Arab Emirates |
1,515 |
2,106 |
39% |
15,536 |
18,704 |
20% |
|
Netherlands |
1,352 |
2,010 |
49% |
17,784 |
17,359 |
-2% |
|
Israel |
265 |
583 |
120% |
14,080 |
17,254 |
23% |
|
Singapore |
1,260 |
1,813 |
44% |
13,485 |
16,181 |
20% |
|
Angola |
870 |
1,029 |
18% |
9,241 |
15,570 |
68% |
|
Lebanon |
1,038 |
1,114 |
7% |
10,912 |
11,048 |
1% |
|
Jordan |
663 |
1,060 |
60% |
10,980 |
10,470 |
-5% |
|
Algeria |
1,304 |
263 |
-80% |
14,899 |
9,932 |
-33% |
|
Philippines |
1,560 |
36 |
-98% |
17,140 |
9,690 |
-43% |
|
Cote d Ivoire |
571 |
728 |
27% |
7,179 |
7,641 |
6% |
|
Palestine |
596 |
823 |
38% |
7,194 |
6,276 |
-13% |
|
Germany |
445 |
659 |
48% |
6,314 |
5,695 |
-10% |
|
Vietnam |
378 |
54 |
-86% |
7,007 |
5,202 |
-26% |